Implementing MES to track individual machine and operator efficiency, identifying bottlenecks in cutting, sewing, and finishing operations, and optimizing workflows to increase throughput during fluctuating seasonal demand.
1. Industry Context & Customer Profile
Industry Segment: Textile & Apparel Manufacturing
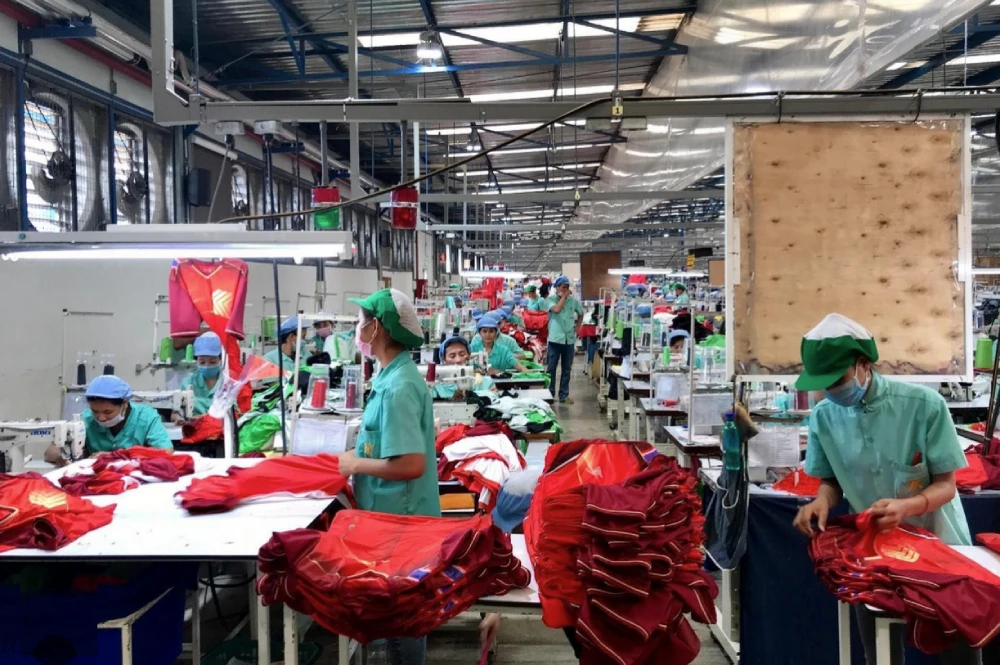
The textile and apparel manufacturing sector represents one of Vietnam’s most significant industrial segments, employing over 2.5 million workers and contributing approximately 16% of the country’s total exports. While Vietnam has established itself as a global textile manufacturing hub, the industry faces intensifying competition from other low-cost production centers, along with increasing pressure for faster turnaround times and greater production flexibility.

Typical Customer
Medium to large textile and garment manufacturers with 200-2,000 employees operating multiple production lines across cutting, sewing, and finishing departments. These companies typically produce for international brands and retailers, managing dozens of styles simultaneously with production runs ranging from small batches (500 units) to mass production (100,000+ units). Many operate under tight delivery schedules with lead times constantly shrinking from traditional 90-day windows to as little as 30 days from order to shipment.
Current Operational Environment
Most textile and apparel manufacturers in Vietnam currently operate with limited visibility into their production efficiency:
- Manual tracking of daily production counts, typically collected at the end of shifts
- Basic spreadsheets for production planning and scheduling
- Limited data on individual operator or machine performance
- Paper-based work orders and production tickets moving with garment bundles
- Reactive rather than proactive management of production bottlenecks
- Little to no real-time visibility into work-in-process status
A production director at a garment factory in Ho Chi Minh City described their situation: “We know our overall output numbers at the end of each day, but we have very little insight into what actually happens hour by hour on our sewing lines. When we miss targets, it takes days of investigation to figure out why, and by then, we’re already behind on the next order.”
2. Critical Pain Points & Challenges
Operational Inefficiencies
Current production approaches create several significant challenges:
- Production bottlenecks often remain undetected until they impact delivery schedules
- Line balancing problems with certain workstations overloaded while others wait for work
- Difficulty identifying specific operations causing production delays
- Limited ability to match operator skills to appropriate workstations
- Production manager time consumed with manual data collection rather than problem-solving
- Lack of objective data to drive continuous improvement initiatives
The production manager at a major apparel manufacturer noted, “With 20 sewing lines and hundreds of operations happening simultaneously, trying to visually identify efficiency problems is like finding a needle in a haystack. By the time we spot an issue, we’ve already lost hours or even days of production capacity.”
Compliance & Quality Concerns
Beyond efficiency, manufacturers face mounting quality and compliance pressures:
- International brands requiring detailed production tracking for social compliance
- Quality issues that aren’t linked to specific workstations or operators for targeted improvement
- Difficulty validating actual production times against standard time estimates
- Limited traceability of quality issues back to specific production factors
- Challenges documenting efficiency improvements for buyer negotiations
These requirements are especially challenging during peak production seasons. One quality manager explained: “When we’re running at maximum capacity during high season, quality issues inevitably increase. Without systematic data on where problems originate, we end up with broad corrective actions that don’t address the root causes.”
Cost Pressures
The financial impact of inefficient production extends throughout operations:
- Labor costs representing 30-40% of production expenses, with significant inefficiency
- Overtime costs increasing during peak seasons due to poor production balancing
- Rush shipping charges when production delays threaten delivery commitments
- Lost business opportunities when capacity is incorrectly estimated
- Higher training costs due to inability to target specific skill development needs
- Margin erosion from inaccurate production cost estimates
Competitive Disadvantages
Manufacturers struggling with efficiency challenges face growing competitive disadvantages:
- Difficulty competing with lower-cost production countries like Bangladesh and Cambodia
- Limited ability to handle quick-turn orders that command premium pricing
- Challenges meeting the growing demand for smaller, more frequent production runs
- Reduced ability to provide accurate delivery commitments to customers
- Difficulty moving up the value chain to higher-margin products requiring greater efficiency
3. DxFactory Solution Overview
Primary DxFactory Components
The DxFactory Production Efficiency Optimization solution centers on a comprehensive Manufacturing Execution System (MES):
- Manufacturing Execution System (MES) – Core platform tracking production in real-time across all operations
- Performance Analytics Module – Advanced reporting and analysis tools
- Visual Factory Displays – Real-time production status visualization
Key Functionalities
The integrated MES solution provides comprehensive production monitoring capabilities:
- Real-time Production Tracking – Minute-by-minute visibility into production progress at each operation
- Individual Performance Monitoring – Tracking of each operator and machine’s efficiency
- Bottleneck Identification – Automatic flagging of workstations falling behind planned rates
- Dynamic Line Balancing – Recommendations for optimal worker assignment based on real-time data
- Production Scheduling – Data-driven planning tools to optimize capacity utilization
- Skills Matrix Management – Tracking of operator capabilities for optimal assignment
- Quality Issue Correlation – Linking of quality problems to specific operations or operators
- Predictive Analytics – Forecasting of potential production delays before they impact schedules
- Production History Analysis – Detailed historical data for continuous improvement
Integration Approach
The DxFactory solution integrates with existing manufacturing environments through:
- Simple barcode scanning at key production points
- Touchscreen workstations for operator interaction
- Large-format displays for production status visualization
- Connection with existing ERP and planning systems
- Mobile applications for supervisors and managers
- Specialized analytics dashboards for different user roles
Technical Requirements
Implementation requires:
- Barcode infrastructure for work-in-process tracking
- Touchscreen terminals at key production points
- Network connectivity throughout production facility
- Server infrastructure (on-premises or cloud-based)
- Large-format display monitors for production areas
- Mobile devices for supervisory personnel
4. Implementation Roadmap
Phase 1: Assessment & Planning (3-4 weeks)
- Evaluation of current production tracking methods
- Process mapping of all manufacturing operations
- Identification of key bottleneck areas and efficiency opportunities
- Development of standard time database for operations
- Design of barcode and tracking methodology
- Configuration of line layouts in MES system
- ROI analysis and implementation planning
Phase 2: Deployment & Configuration (4-8 weeks)
- Installation of server infrastructure and network connectivity
- Setup of barcode scanning stations and touchscreens
- Configuration of MES system with product and process data
- Development of custom reports and dashboards
- Integration with existing systems where applicable
- Setup of large-format production displays
- Configuration of alerts and notification workflows
Phase 3: Training & Adoption (2-4 weeks)
- Training of line operators on scanning procedures
- Supervisor training on dashboard utilization
- Management training on analytics and reporting
- Pilot implementation on selected production line
- Process refinement based on initial feedback
- Development of standard operating procedures
- Change management and communications program
Phase 4: Optimization & Expansion (Ongoing)
- Performance review after first month of operation
- Refinement of standard times based on actual data
- Expansion to additional production lines
- Implementation of advanced analytics
- Development of incentive programs tied to efficiency metrics
- Integration of quality data for comprehensive analysis
5. Value Delivery & ROI Analysis
Immediate Benefits
Within the first three months of implementation, manufacturers typically experience:
- 10-15% increase in production throughput through bottleneck identification and elimination
- 90% reduction in time spent collecting and compiling production data
- 30-40% improvement in response time to production issues
- Complete visibility into actual vs. planned production at every stage
- 20-25% reduction in overtime costs through better line balancing
A production supervisor at an early adopter shared, “The difference was immediate. Instead of finding out at the end of the day that we missed our targets, we now see potential problems developing in real-time. Just yesterday, we identified a bottleneck at pocket attachment operations by 9:30 AM and redistributed work to keep the line flowing.”
Operational Improvements
Measured improvements after 6-12 months include:
- Overall equipment effectiveness (OEE) increased by 15-20%
- Production planning accuracy improved from typical 70% to 90%+
- Worker utilization increased by 12-18%
- Training effectiveness improved through targeted skill development
- On-time delivery performance improved from industry average of 80% to 95%+
Financial Impact
A typical medium-sized textile or apparel manufacturer can expect:
- Return on investment within 6-10 months
- Labor cost savings of 8-12% through improved efficiency
- Reduction in overtime expenses of 20-30%
- Decreased late delivery penalties and expedited shipping costs
- Capacity increase equivalent to 10-15% without additional equipment investment
Competitive Advantage
Manufacturers implementing the DxFactory MES solution gain significant competitive advantages:
- Ability to accept shorter lead time orders with confidence
- Enhanced capability to handle high-mix, low-volume production profitably
- Improved pricing accuracy based on actual production data
- Greater flexibility to manage seasonal demand fluctuations
- Data-driven negotiations with buyers regarding price and delivery terms